

Data-Driven Updates on Soybean Seeding Rates in North Carolina
go.ncsu.edu/readext?993505
en Español / em Português
El inglés es el idioma de control de esta página. En la medida en que haya algún conflicto entre la traducción al inglés y la traducción, el inglés prevalece.
Al hacer clic en el enlace de traducción se activa un servicio de traducción gratuito para convertir la página al español. Al igual que con cualquier traducción por Internet, la conversión no es sensible al contexto y puede que no traduzca el texto en su significado original. NC State Extension no garantiza la exactitud del texto traducido. Por favor, tenga en cuenta que algunas aplicaciones y/o servicios pueden no funcionar como se espera cuando se traducen.
Português
Inglês é o idioma de controle desta página. Na medida que haja algum conflito entre o texto original em Inglês e a tradução, o Inglês prevalece.
Ao clicar no link de tradução, um serviço gratuito de tradução será ativado para converter a página para o Português. Como em qualquer tradução pela internet, a conversão não é sensivel ao contexto e pode não ocorrer a tradução para o significado orginal. O serviço de Extensão da Carolina do Norte (NC State Extension) não garante a exatidão do texto traduzido. Por favor, observe que algumas funções ou serviços podem não funcionar como esperado após a tradução.
English
English is the controlling language of this page. To the extent there is any conflict between the English text and the translation, English controls.
Clicking on the translation link activates a free translation service to convert the page to Spanish. As with any Internet translation, the conversion is not context-sensitive and may not translate the text to its original meaning. NC State Extension does not guarantee the accuracy of the translated text. Please note that some applications and/or services may not function as expected when translated.
Collapse ▲Soybean seeding rate decisions have become more nuanced due to rising seed costs and shifting management strategies. The wide range of planting dates (late March to late July) and maturity groups (MG2-8) used in this state interact with the optimal soybean seeding rates.
Field research has been conducted the past several years across the state to understand how soybean seeding rate impacts soybean yield across diverse production practices. We have been evaluating soybean seeding rates of 75,000 seeds/A, 100,000 seeds/A, 125,000 seeds/A, 150,000 seeds/A, and 175,000 seeds/A using soybean maturity groups II-IV (indeterminate) and V-VII (determinate) across soybean planting dates from mid- March through mid-July to determine how seeding rate impacts yield and revenue. All plots were planted on 15 inch row spacing. This article will highlight a couple questions answered through this research.
It is important to note that these recommendations are complex and therefore in April 2024 a dynamic Decision Support Tool will be released by NC State Extension which will allow producers to identify their location in the state, their planting date, and their maturity group and then a seeding rate prediction will be made for that unique production scenario. This is a more optimal way to use this data than the static tables in this article but these can be used for broad conclusions.
Should soybean seeding rate be adjusted across the three regions in North Carolina?
North Carolina is known for having three major production regions: Coastal Plain, Piedmont, and Tidewater. These regions are characterized by their soil type, weather patterns, and rotational complexity, all which impact productivity. Questions have arisen about the need to adjust our seeding rate recommendations based on the different regions in North Carolina, however results from this research indicate that yield response to seeding rate is somewhat consistent across the production regions in the state (Figure 1). Planting date and maturity group have a larger impact on the need to adjust seeding rate than region within the state does.
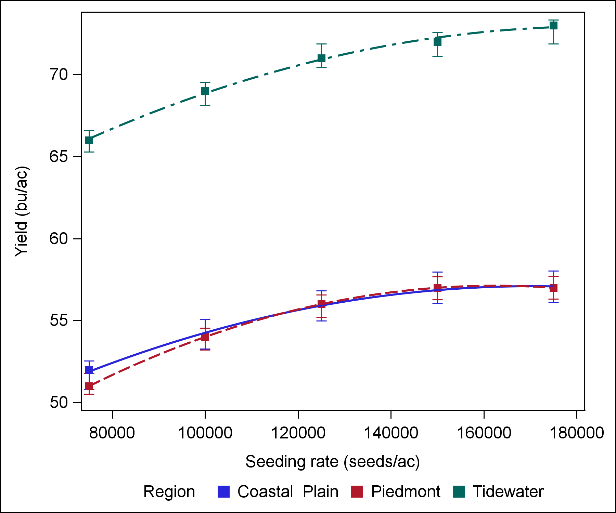
Figure 1. Soybean seeding rate impact on yield (combined over planting dates, maturity groups, and 15 NC environments) in the Coastal Plain, Piedmont, and Tidewater Regions
How should seeding rates be adjusted depending on planting date and maturity group?
Soybean planting date and maturity group selections are two of the most important management considerations for optimizing soybean production practices in North Carolina and both interact with seeding rate.
Planting Date: This research found as in previous research that seeding rate needs to increase as planting date is delayed to maximize both yield and revenue. In earlier planting situations before mid-May, soybean seeding rates of 120,000- 150,000 seed/A generally maximized yield, while with later planting dates (past mid-June) seeding rates between 165,000-175,000 seeds/A were needed to maximize yield.
Maturity Group: When using earlier soybean maturity groups (II-IV), higher seeding rates (+20,000-25,000 seeds/A) were often needed to maximize soybean yield than when using later soybean maturity groups (V-VIII).
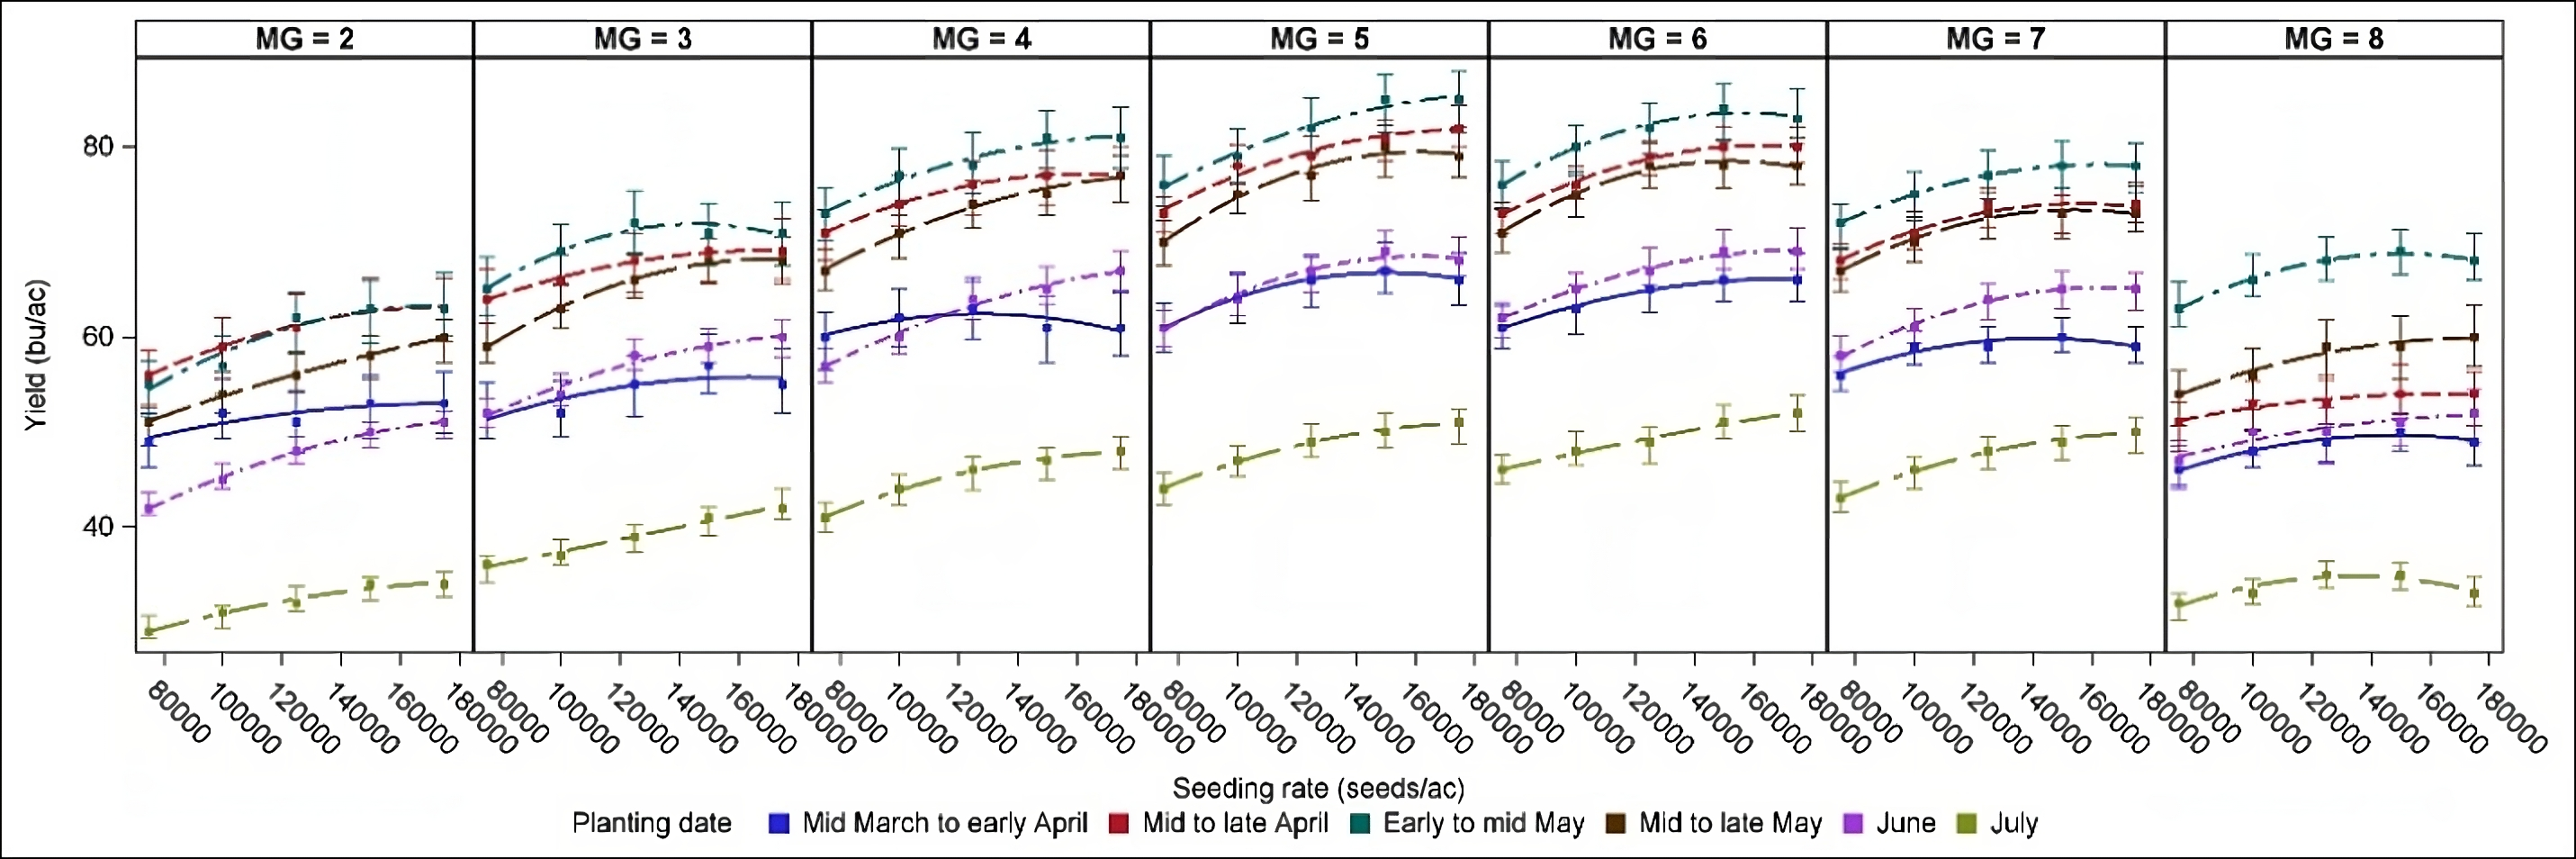
Figure 2. Seeding rate impact on soybean yield across planting dates for each maturity group combined over 15 NC environments
How does the agronomically optimal seeding rate (seeding rate that maximizes soybean yield) differ from the economically optimal seeding rate (seeding rate that optimizes income)?
There is a cost associated with using higher than needed seeding rates and therefore it is important to understand the economically optimal seeding rates. Across all soybean planting date and maturity group combinations in this research, the agronomically optimal seeding rate (seeding rate that maximized yield) was higher than the economically optimal seeding rate (Figure 3). On average, for all these planting dates and maturity group combinations, the seeing rate that maximized revenue was 18,000 seeds/A lower than the seeding rate that maximized yield.
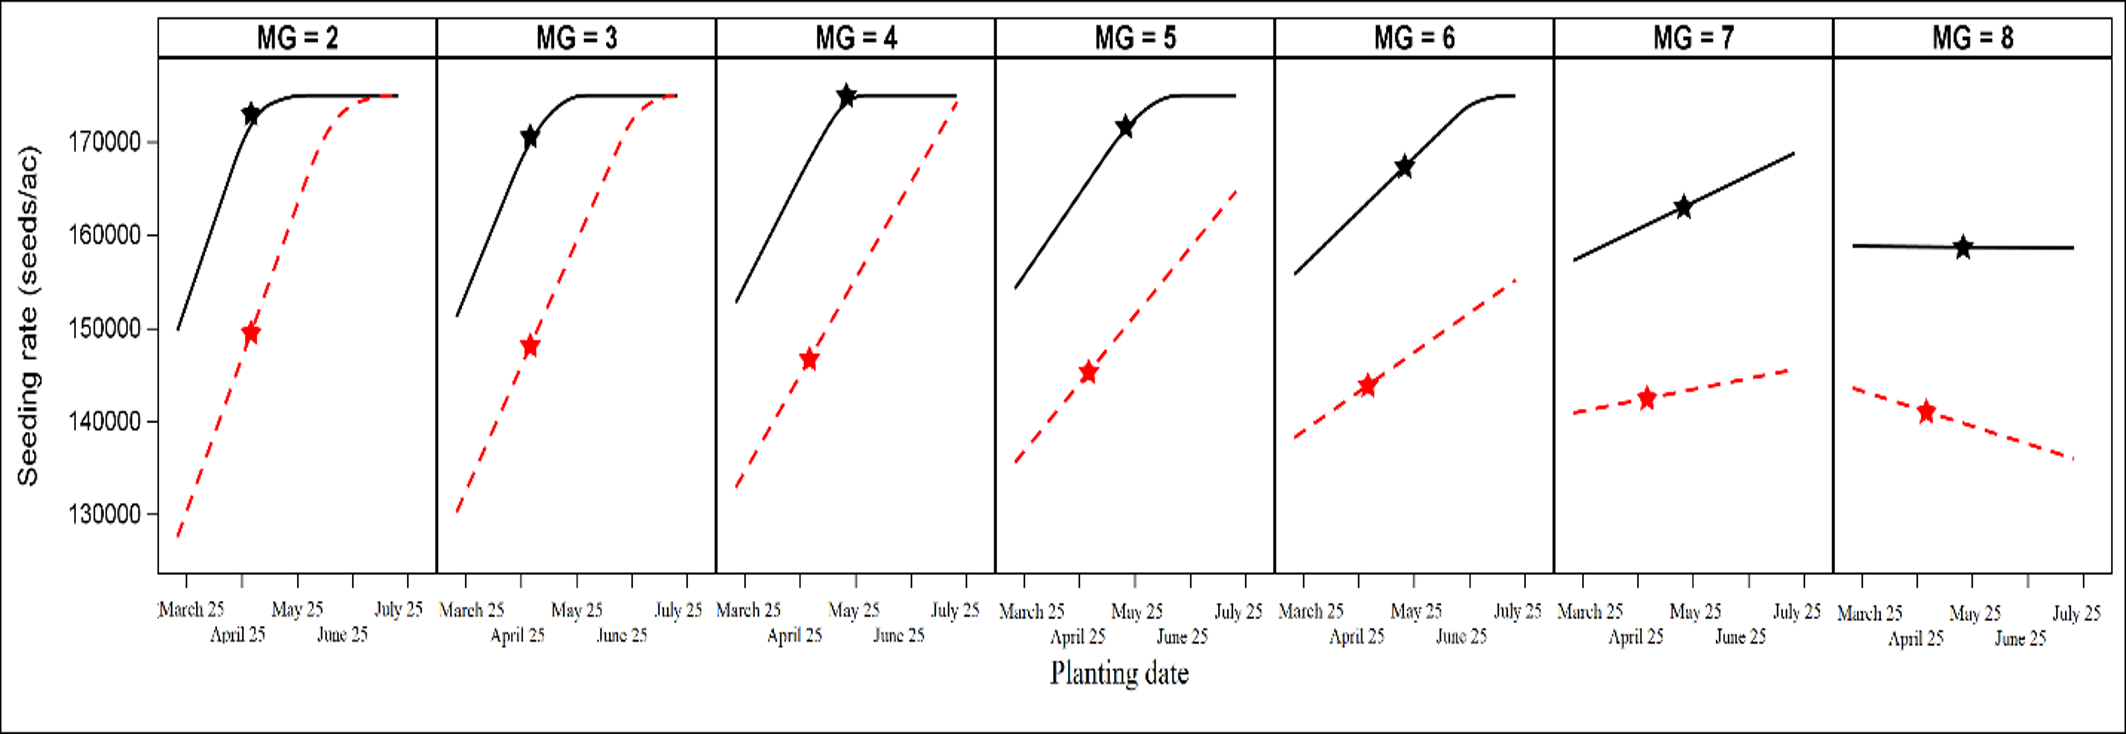
Figure 3. Seeding rate that maximized yield (black line) and revenue (red line) for each maturity group across planting date combined over 15 NC environments. The black star represents the planting date and seeding rate that maximized yield for that maturity group. The red star represents the planting date and seeding rate that maximized revenue for that maturity group